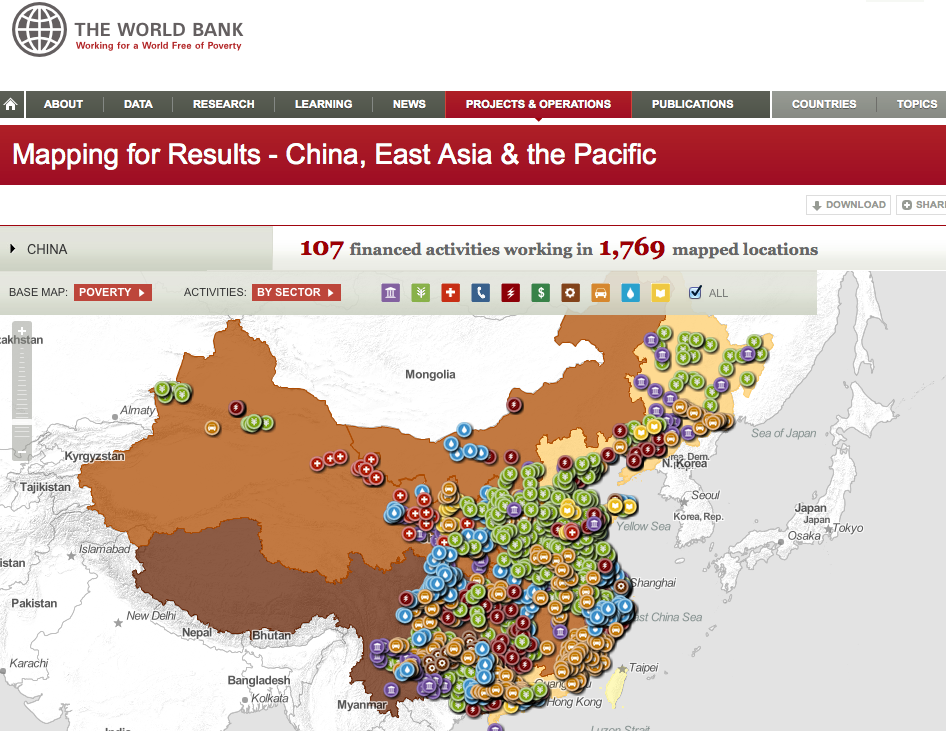
The interactive map on the World Bank website can be used to access a wealth of Open Data about development in countries around the globe. With a GDP of $8.358 trillion China is now classed as an upper middle income country.
The map below shows what development projects are taking place and more can be found out with a click of a button. Year 13 students can use this to understand how China is developing and how peoples' quality of life might improve across the country.
The map below shows what development projects are taking place and more can be found out with a click of a button. Year 13 students can use this to understand how China is developing and how peoples' quality of life might improve across the country.
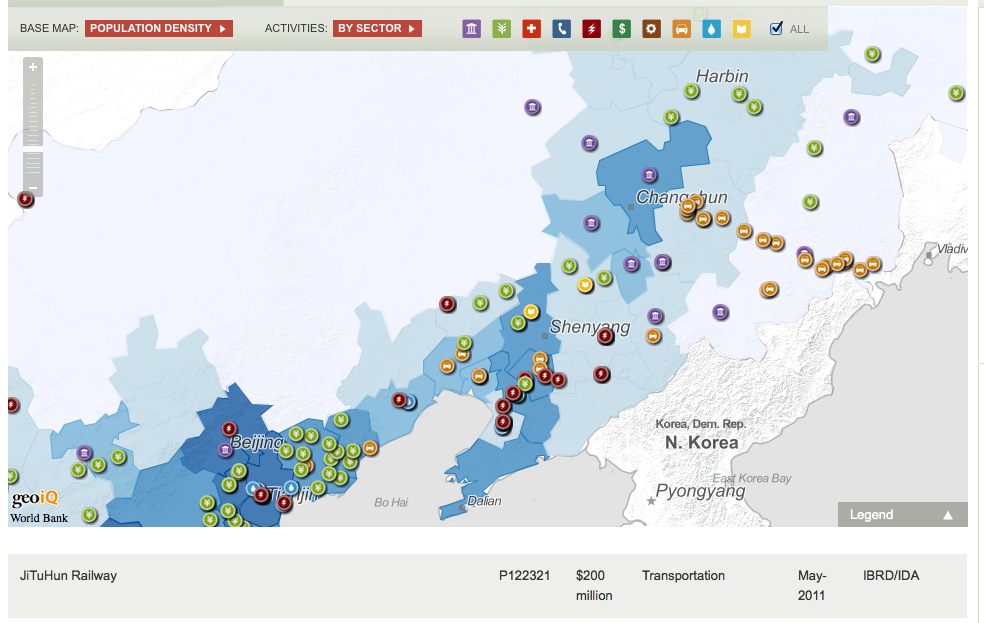
If you focus in on an area, for example around the area of Harbin, you can see geographical patterns to the type of projects taking place. The $200 million JiTuHun Railway project, connecting the cities of Jilin and Hunchun in Jilin province with a double line track capable of supporting trains running at 250 km/h, stands out as a linear series of orange symbols.
What other patterns can be seen in the data? Where are similar projects taking place? Are the types of project related to the population density in an area?
What other patterns can be seen in the data? Where are similar projects taking place? Are the types of project related to the population density in an area?
 RSS Feed