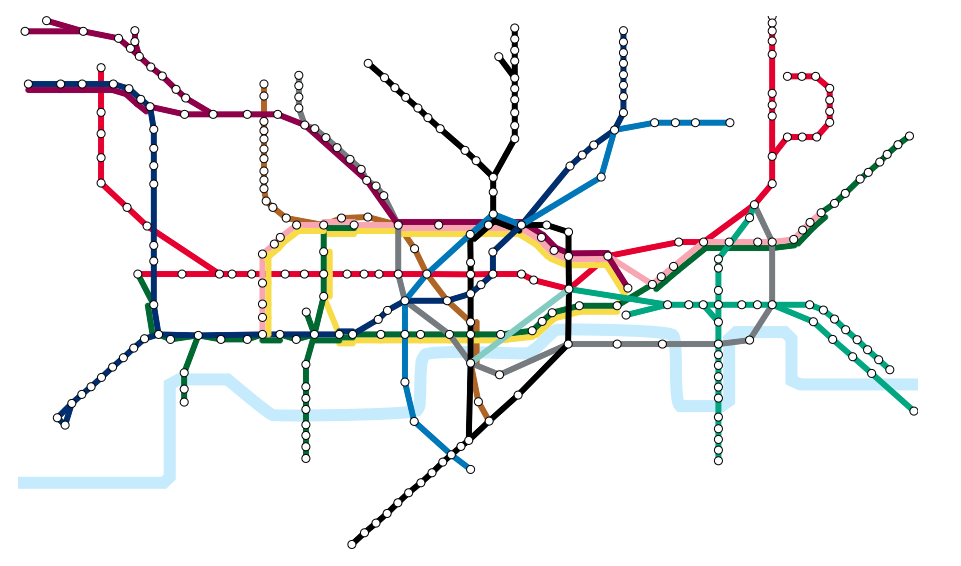
If you are curious to see what the price of renting in London is, then this is a very useful Interactive Map - link here. The property rental service Find Property have used their database to calculate and display the average rental cost for homes within a kilometre of each tube station in the capital. Click on a tube line and a neat graph shows the average cost of property appears. The data displayed can be organised according to the number of bedrooms.
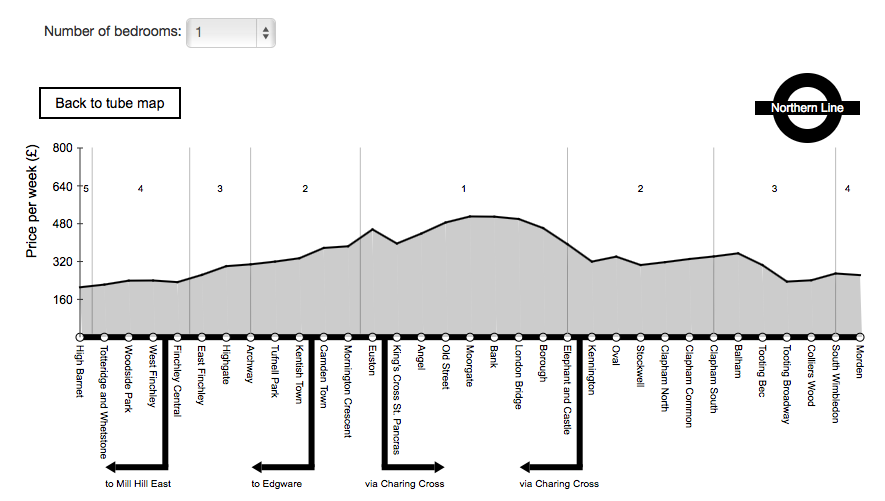
The two following graphs show the Northern line, the cost of one-bedroom properties rising from approximately £200 a week in Zone 4 up to £510 a week in Zone 1. Source: Find Property
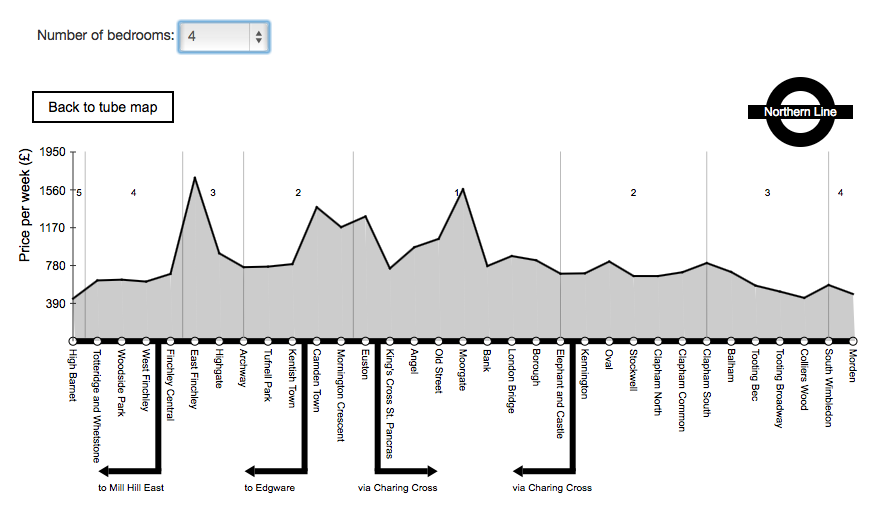
The pattern for four-bedroom properties shows sharp spikes at £1684 in East Finchley and £1567 at Moorgate. As the data is updated in real time, if there are no properties for rent, the location will show as £0
Discussion:
1. What does this Interactive tell you about the costs of renting in the capital?
2. What factors might cause the variation in rental prices across the capital?
3. Would you spend more on property rentals and live centrally or would you choose to live further out and commute to work if you had the choice?
 RSS Feed