NOAA View is a newly published and useful portal to maps of NOAA data from a variety of satellite, model, and other analysis sources.
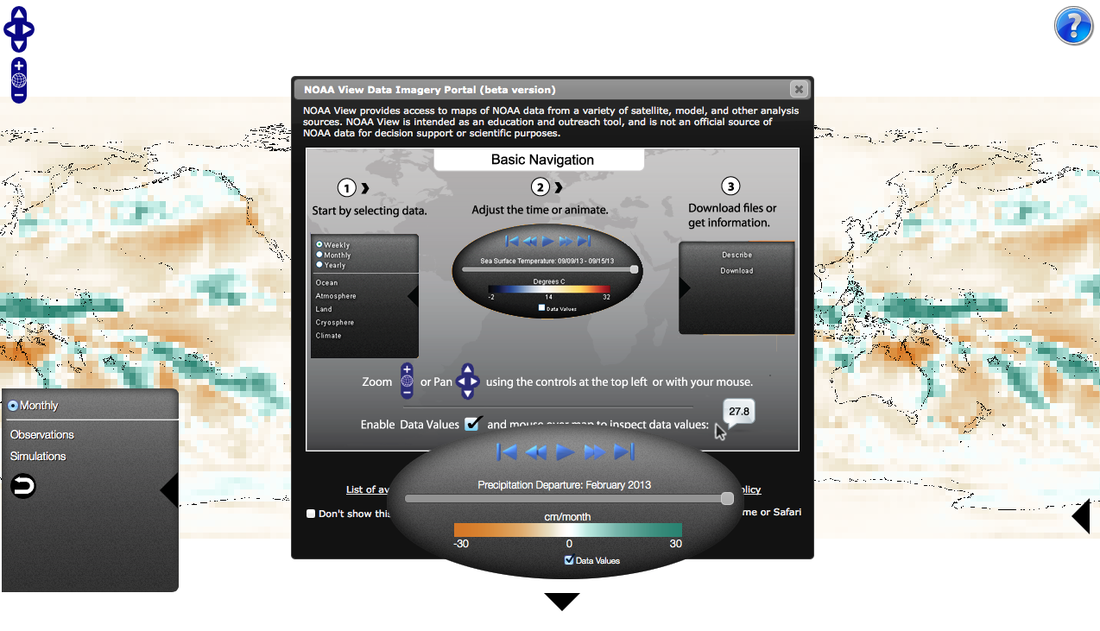
An example of where such a resource could be used is for students to look up the global variation in precipitation data for August 2004, as a starter activity, before studying the Boscastle floods. The screenshot above shows this map and the Image portal instruction box.
NOAA View has been created as an education and outreach tool, and will be valuable to show changing climate, air, oceans land and ice conditions through time.
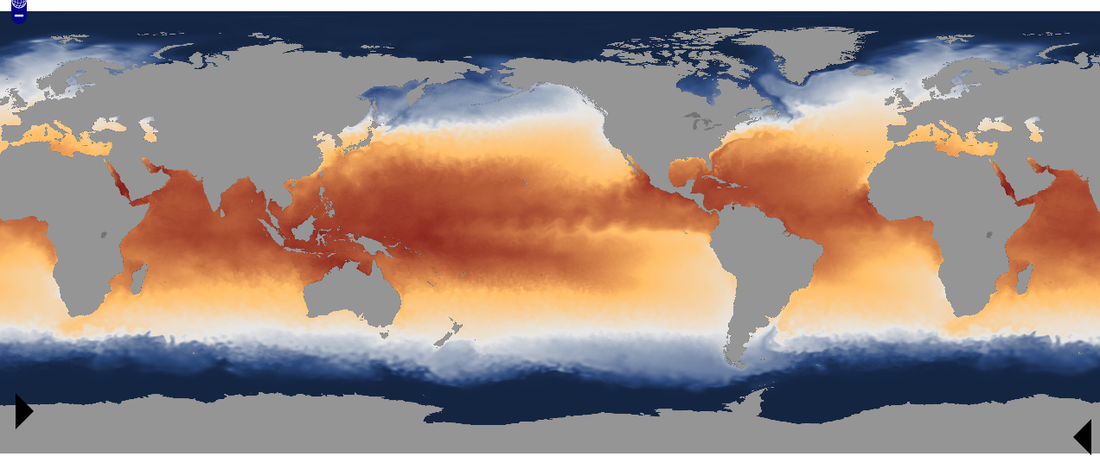
AS students might want to look at the variation in ocean temperatures for El Nino and La Nina years.This image is for the ocean surface temperatures in September 1997, the strongest strongest event ever recorded. A nice feature of this data imagery is that the map is moveable, so that the Pacific Ocean can be centrally located.
NOAA View has been created as an education and outreach tool, and will be valuable to show changing climate, air, oceans land and ice conditions through time.
AS students might want to look at the variation in ocean temperatures for El Nino and La Nina years.This image is for the ocean surface temperatures in September 1997, the strongest strongest event ever recorded. A nice feature of this data imagery is that the map is moveable, so that the Pacific Ocean can be centrally located.
 RSS Feed